Bitcoin bulls bruised as $60k support becomes last stand amid ETF exodus and bearish onslaught
The gist
Bitcoin bulls are on the ropes as $60,000 support becomes the last line of defense against relentless ETF outflows and intensifying bearish momentum.
What to know
- After a failed breakout in May, Bitcoin slid from a $79,000 resistance wall to test critical support levels amid $1.8 billion in spot ETF outflows.
- Technical breakdowns—including a triple-top reversal and breach of the 200-week moving average—have signaled a shift toward a bearish, risk-heavy environment.
- Analysts warn that losing $60,000 support could open the floodgates to $53,000 or even $30,000, framing the current chop as a make-or-break accumulation phase.
Resistance Showdown at $79K
Bulls and bears waged a high-stakes standoff at $79,000, with conflicting signals and cautious trader positioning fueling a tense, range-bound battle.
From early to mid-May 2026, Bitcoin traded within a tight range roughly between $75,000 and $79,000, reflecting a tense standoff between bulls and bears. Despite a notable price spike that briefly pushed levels higher, volume remained insufficient to confirm a decisive breakout, leaving the market vulnerable to false moves and trapping traders on both sides. This compression around key resistance near $79,000 underscored the ongoing battle to hold critical thresholds, with the 9 and 18 EMAs guiding a modest short-term upward trend amid broader uncertainty.
Technical indicators during this period sent mixed signals, notably a bearish crossover forming between the 200 EMA and 200 MA, which suggested caution despite short-term bullish momentum. This nuanced technical backdrop mirrored the market’s indecision, as traders hedged their bets by simultaneously holding long and short positions, preparing for a significant move once the consolidation resolved. As one analyst noted on May 15, maintaining positions on both sides was a strategic response to the tug-of-war unfolding beneath the surface.
The $79,018 resistance level emerged as a pivotal battleground, with bears striving to keep Bitcoin below this line to maintain control, while bulls aimed to reclaim and hold above it to push toward targets like $85,000. By mid-May, despite a bounce off recent lows, bulls faced an uphill challenge reclaiming this critical zone, as reflected in mixed trader sentiment where 47% refrained from buying the dip and 22% took short positions. This cautious positioning highlighted the market’s uncertainty and the fragile nature of upward momentum at this juncture.


ETF Outflows Feed the Slide
Relentless spot ETF withdrawals and stubborn macro headwinds deepened Bitcoin's losses, as failed breakouts and technical exhaustion kept the price trapped below critical resistance.
In late May 2026, Bitcoin's bearish momentum intensified following its failure to maintain support above the critical $80,500 level, with the 50-day EMA at $76,000 emerging as the last significant technical defense before risking a return to year-to-date lows. This decline was exacerbated by macroeconomic headwinds, including sustained pressure on 30-year Treasury yields, escalating Middle East tensions, and notable spot Bitcoin ETF outflows totaling $1.8 billion over five trading days, with BlackRock's IBIT fund alone losing $448 million on May 18, underscoring the external pressures weighing on the market.
Despite several recovery attempts, Bitcoin repeatedly failed to break through the stubborn resistance zone between $77,000 and $79,000, with technical patterns such as a triple-top bearish reversal and a breakdown of ascending trendline support signaling exhaustion of bullish momentum and a shift to a localized downtrend. TradingView analyses highlighted persistent upper trendline resistance suppressing price advances, while bearish order blocks and rejections at the 918 EMA reinforced the strength of this resistance, keeping Bitcoin range-bound and vulnerable to further downside.
Market sentiment remained cautious as declining trading volumes—hovering around $11 million in 24-hour liquidations, well below the typical $20-$30 million threshold for strong moves—reflected weak buy pressure and limited liquidity, reinforcing bearish control below key moving averages and RSI pivot levels. Analysts like Paul Howard of Wincent framed the ongoing price weakness as primarily macro-driven rather than crypto-specific, with the $78,000 to $79,000 range acting as a major liquidity battleground where $79 million in liquidity is concentrated, intensifying the tug-of-war between bulls and bears.
Geopolitical uncertainties, including fluctuating developments in Iran-US negotiations, contributed to choppy price action and fakeouts, further complicating Bitcoin's path forward. While the market consolidated around the $75,000 support level amid bearish technical indicators like a bear-controlled MACD and RSI still above oversold zones, downside risks loomed with potential retests of $74,000 and $70,000 supports, and even a drop toward $58,000 if critical levels failed. A potential bullish catalyst—the anticipated 'bull moon' event on May 31—offered a glimmer of hope for temporary upward momentum, though bearish control was expected to persist until then.

Support Breach Sparks Liquidations
Aggressive shorting and hundreds of millions in liquidations followed Bitcoin’s drop below $74,400, with technical breakdowns threatening a cascade toward far lower price zones.
By the end of May, Bitcoin was precariously testing critical support levels around $72,000, with analysts warning that a decisive break below this threshold could trigger a steep decline toward $60,000 or even $45,000. This risk was underscored by a bearish market structure confirmed when Bitcoin slipped below $74,400, prompting traders to adopt short positions aggressively, as evidenced by a massive $871 million in short liquidations signaling a shift in market sentiment.
Despite a technical bounce off the $73,200 retest point and some optimism for a weekend recovery near the low $70,000s, bearish momentum remained dominant, with declining volume and rejection at the 21 EMA reinforcing caution among traders. Analysts cautioned that failure to reclaim resistance near $78,000 could result in another lower high, potentially precipitating further breakdowns and exacerbating downside risks.
Entering early June, Bitcoin broke down below its rising channel, slipping under $71,000 and confirming bearish control as indicated by MACD dominance and an RSI plunging below 30 into oversold territory. While this oversold condition hints at a possible short-term bounce, analysts warned that without a strong recovery, Bitcoin might retest much lower support zones, ranging from $58,000 down to as low as $40,000, reflecting deepening selling pressure and a potential extended correction.

200-Week Average: Last Line
Bitcoin’s fate hinges on the historic $60,000 support, as muted volume and oversold signals hint at a make-or-break accumulation phase for patient investors.
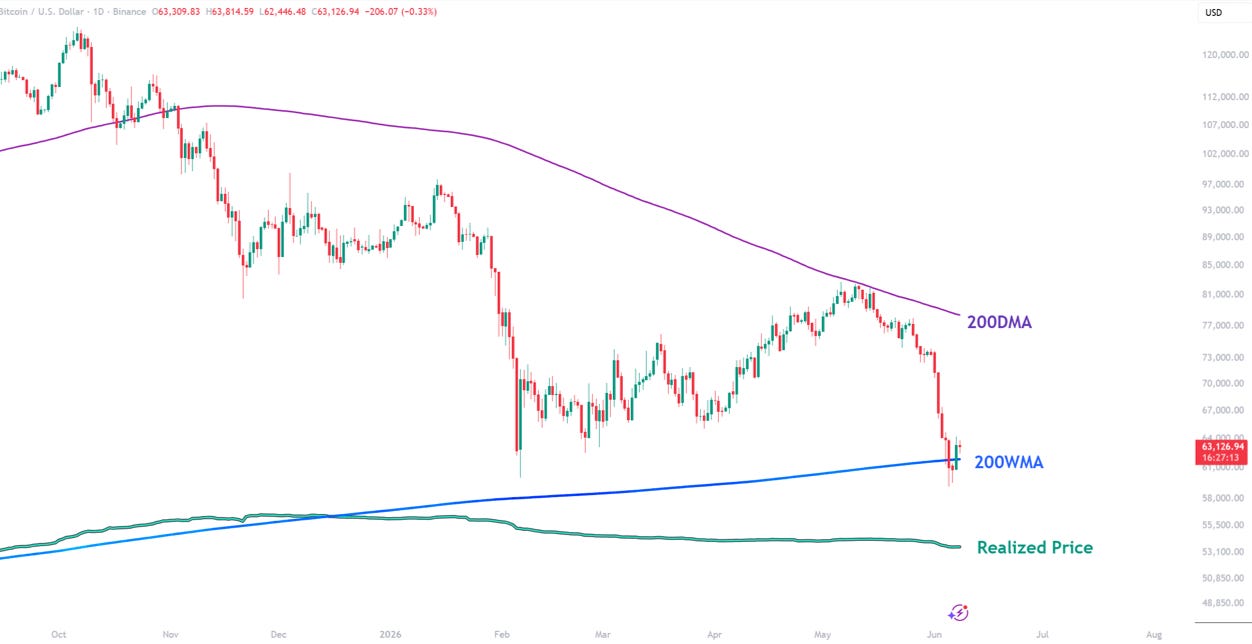
By early June 2026, Bitcoin was closely testing its historically significant 200-week moving average near $60,000, a level that has repeatedly acted as a magnet during both bull and bear markets. This critical support, highlighted by analysts as a key cyclical bottom marker, was approached with mixed market signals: while short-term charts indicated oversold conditions and potential for a bounce, broader technical indicators like the weekly RSI failing to recapture 50 suggested persistent bearish momentum. The muted trading volume during this decline further implied that the market might be entering a prolonged consolidation phase rather than a decisive breakdown, setting the stage for a potentially 'boring' but crucial accumulation period before any meaningful rally.
Historical patterns and recent price action suggested that Bitcoin could dip below the 200-week SMA and linger in a sideways trading range through the summer months, rather than experiencing a sharp V-shaped recovery. Analysts emphasized that while holding above this long-term support would signal buyer conviction and reduce downside risk, failure to maintain this level could expose Bitcoin to deeper support zones around $53,000 and even as low as $30,000. Despite the discomfort such a scenario might cause in the short term, these periods have traditionally represented rare accumulation opportunities for long-term investors, underscoring the importance of patience as the market potentially bases out before a recovery in Q4.