Debt-fueled squeeze widens america’s financial divide
The gist
America’s financial divide is exploding as debt-financed survival pushes half the country into distress while the ultra-wealthy pull further ahead.
What to know
- Nearly 47% of Americans reported serious financial trouble by October 2026, with inflation outpacing wages and delinquencies rising.
- Consumer spending is being propped up by record-high credit card rates (22.3% APR) and a savings rate that’s plunged to 3.5%.
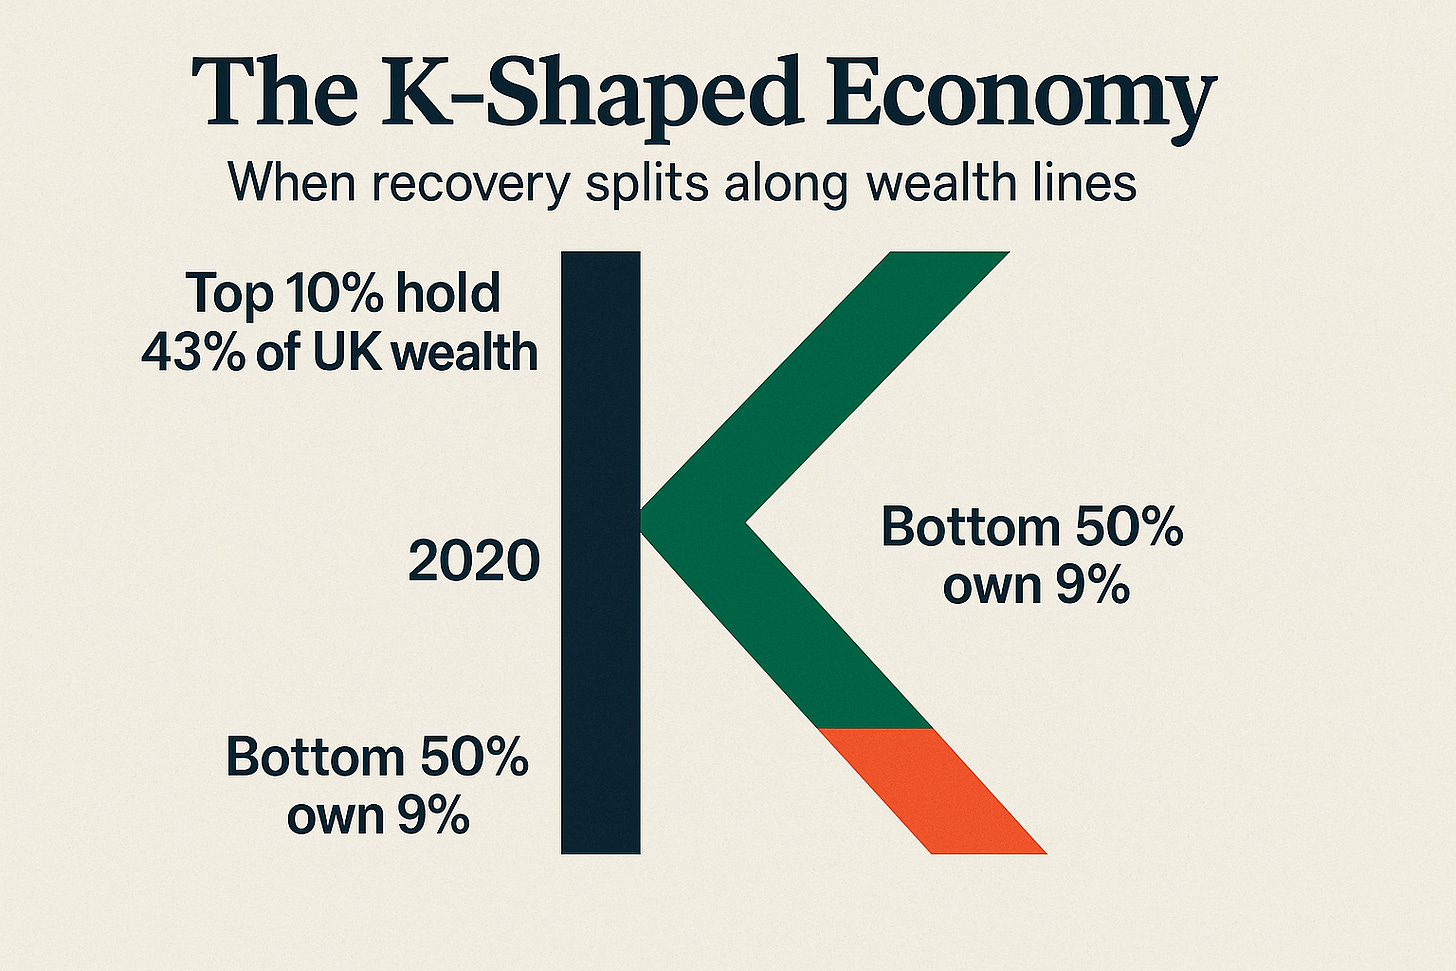
- The top 1% pocketed $1.8 million in new wealth since 2024 while the bottom 50% gained just $1,200—sharpening a K-shaped recovery.
Old Metrics Miss New Pain
Traditional inflation measures masked the true scope of post-pandemic financial distress, prompting economists to adopt new income-specific indices that reveal deeper, uneven hardship.
To understand why October 2026 surveys and Federal Reserve data registered a sharp rise in financial distress, it helps to start with the pre-pandemic baseline: “Before the COVID-19 pandemic, inflation was relatively stable near the Federal Reserve's 2% objective, and wage growth averaged roughly 3.5% annually.” That earlier balance made household budgets more predictable and also shaped how economists read price pressure, relying largely on headline CPI or aggregate PCE inflation as representative of the typical household experience before 2020.
That framework became less adequate once the old equilibrium broke down, because “This norm was displaced by the post-pandemic inflation and labor-market shock starting in March 2020.” Just as importantly, the pre-2020 approach did not account for differing expenditure compositions across income groups, so it was replaced by income-specific price indices after 2020—a methodological shift that helps explain why later readings of consumer strain, confidence erosion, and delinquency pressure captured a more acute and uneven financial reality by October 2026.
Borrowing Masks Wage Stagnation
Surging credit card debt and plummeting savings are propping up spending, exposing how working Americans are trapped by rising costs and flat real wages.
What looked like consumer resilience in 2026 was increasingly a cash-flow illusion. Lighthouse Macro contrasted the “Surface narrative: ‘Consumer spending is growing 2.6% real’” with a harsher reality: spending was being funded less by income than by borrowing, as “The saving rate has collapsed to 3.5%” and “Consumers are borrowing at historically expensive rates to maintain spending,” with credit card APRs averaging 22.3%; on Bloomberg Talks, consumers were paying about $160 billion in credit-card interest, while more were making only minimum payments.
That squeeze fell hardest on households dependent on wages, not assets. Fortune reported inflation near 4% while average hourly earnings rose 3.6%, with real pay turning “flat to negative,” and Bloomberg Talks said workers were quitting less because there were “fewer opportunities than there were say two or three years ago,” leaving young graduates already burdened by student debt and housing costs; meanwhile, The Paul Barron Crypto Show described a widening split in which “American consumers, especially those at the top… the 1 percenters, the 2 percenters, they’re still spending,” even as searches for mortgage help surpassed 2008-era levels and “these credit card delinquencies, this is a problem.”




Wealth Drives Recovery Divide
Affluent asset holders are powering consumer spending while lower-income households cut back, deepening the K-shaped split in America’s economic rebound.
The consumer recovery looks increasingly K-shaped because spending strength is being carried by households with assets, not by broad wage-based demand. The Media Stack put it bluntly: “The answer lies in wealth, not wages,” noting that the top 10% now drive 49% of all consumer spending and that Morgan Stanley says the top 40% control 85% of America’s wealth; as Morgan Stanley CIO Lisa Shalett summarized, “That means 90% of the country is only half the consumption,” a split also visible in Delta’s forecast that premium and business seats will eclipse main-cabin revenue in 2026, a year ahead of schedule.
Below that affluent tier, the spending story is increasingly one of strain management: weaker traffic at mass and fast-casual chains, tighter selectivity, and heavier reliance on balance sheets. Inevitability Research highlighted Chipotle’s same-store sales rising just 0.3% versus roughly 0.7% expected, while Sweetgreen’s same-store sales fell 9.5% and traffic dropped 11.7%; Odd Lots described the financing mechanism, saying “those that were initially impacted… were the lower income households,” and that for “the first sort of… six months, nine months, that was the group that was seeing the biggest year over year” pressure, after pandemic-era “credit health… improved dramatically,” but a “consistent imbalance” between inflows and outflows began depleting savings, and “come 2023 forward” middle- and higher-income households started feeling it too, though lower-income households “are the first to” crack.



Richest 1% Pull Away Fastest
Nearly all recent wealth gains have gone to the top 1%, who grew their fortunes thousands of times faster than the bottom half of Americans.
Measured inequality widened not because everyone stalled, but because gains became radically concentrated at the top. Fortune, citing BCG, noted that some younger cohorts have out-earned predecessors — the oldest Gen Z workers at 28 make a median $42,000 in constant dollars, 25% more than Millennials did at that age and 50% more than Boomers — yet that broad generational progress sits beside a far steeper class divide, with the most recent federal income tax data showing the top 1% of taxpayers made $675,602 in adjusted gross income.
The wealth data is even starker: Fast Company reported that households in the top 1% increased their net worth by $1.8 million on average between 2024 and early 2026, while the bottom 50% added just $1,200 in two years. Across three quarters of last year, the top.1% and top 1% held their highest wealth shares ever recorded, with the top.1% alone gaining $9.6 million; by those numbers, the upper tier grew wealth 8,000 times more than the 68 million households in the bottom half.