S&p 500 walks a gamma tightrope: volatility surges as market structure turns fragile
The gist
The S&P 500 has flipped into a negative gamma zone, sending volatility surging and exposing a fragile market structure just as event risks loom large.
What to know
- The S&P 500 closed 119 points below its dealer gamma flip level at 7,503 in early June, turning dealers from volatility dampeners into amplifiers and rattling market stability.
- Despite violent price swings—including a 39.68% VIX spike and a 3.27% intraday range on June 10—over 58% of S&P 500 stocks still trade above their 200-day averages, signaling the chaos is driven more by options dynamics than true market deterioration.
- With the index stuck below resistance at 7,440–7,458.50 and the crucial gamma flip now at 7,520, failing to reclaim this level risks even sharper downside as dealers hedge more aggressively ahead of CPI and earnings catalysts.
Dealers Fuel Volatility Spiral
With the S&P 500 stuck in a negative gamma regime, dealer hedging has flipped from cushioning volatility to amplifying every price swing, turning a once-stable market structure into a powder keg.
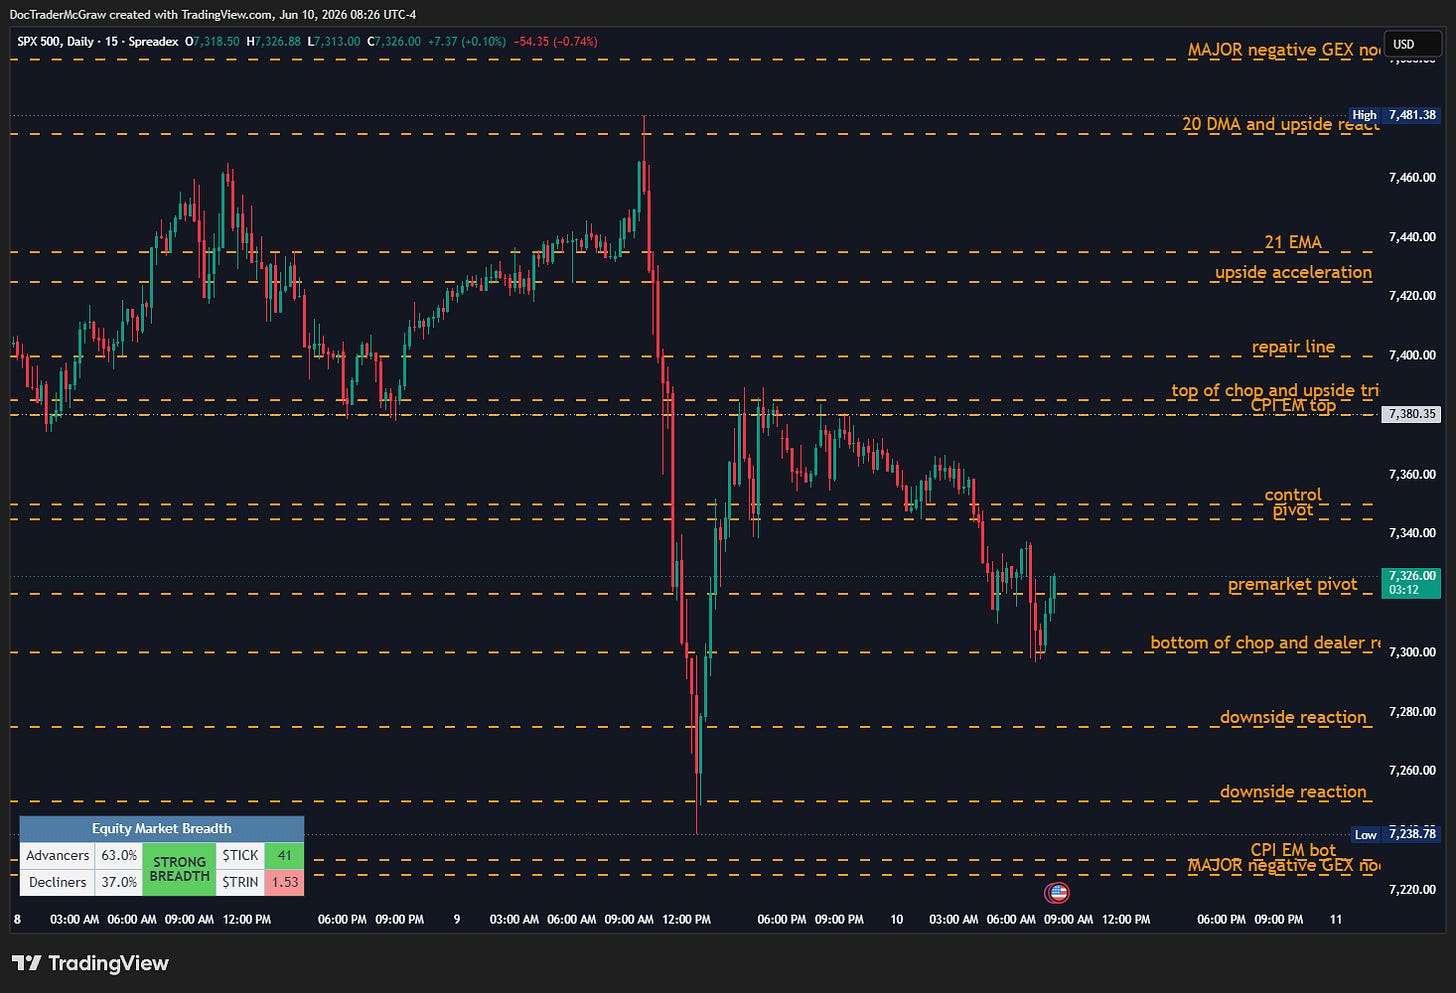
By early June 2026, the S&P 500 decisively crossed into a negative gamma environment, closing 119 points below the critical dealer gamma flip level at 7,503, a line that had anchored the rally from 6,275 to 7,580 for eight weeks. This transition transformed the previously supportive gamma flip line into a resistance level, signaling a fragile market structure that hinges on reclaiming this threshold to restore dealer positioning to positive gamma and reduce volatility.
In this negative gamma regime, dealers shift their hedging behavior from providing mechanical support—buying into weakness and selling into strength—to amplifying volatility by selling into weakness and buying into strength. This reversal was vividly illustrated by Friday’s 2.64% single-day drop and subsequent volatile price swings, underscoring how dealer positioning now exacerbates market moves rather than smoothing them, thereby destabilizing the market’s internal structure.
Despite the fragile structure induced by negative gamma and volatile dealer flows, broad market breadth remains relatively intact, with key breadth metrics well above regime-shift thresholds. This suggests that the current instability is driven more by dealer hedging dynamics and volatility signals than by fundamental deterioration in market participation, highlighting a delicate balance where dealer positioning and event risks—such as the upcoming CPI report—could tip the scales toward amplified price swings.
As of mid-June, the dealer gamma flip level has risen to 7,520, positioning just beneath the S&P 500 and creating a precarious setup where even a minor breach could rapidly flip dealer hedging from positive to negative gamma. This proximity to the flip level, combined with a post-FOMC bounce and ongoing rollover gaps, crafts a market environment that remains vulnerable to sudden volatility spikes and fragile price action, demanding heightened caution from traders navigating these shifting gamma dynamics.


Event-Driven Volatility Unleashed
Aggressive options activity and systematic selling have turbocharged intraday swings, with volatility term structures signaling markets braced for even bigger moves around key events.
Since 2020, volatility patterns have evolved into a more reactive and event-driven regime, with the VIX demonstrating strong rebounds on Mondays following significant Friday panic days—such as the recent +39.68% VIX spike that fits well within historical panic ranges. This behavior underscores an increased amplitude of price swings, where dips are bought aggressively but volatility remains elevated, reflecting a market environment prone to rapid intraday rallies and sharp reversals, as evidenced by the typical 0.65%+ open-to-high Monday rallies after such spikes.
The recent liquidity-driven sell-off in the S&P 500, characterized by a swift 130-170 point flush on Friday followed by a classic squeeze back up, highlights the fragile market structure underpinning current price action. Systematic option selling, particularly through complex put-credit-spread trades and iron condors, has intensified negative delta feedback loops, where falling prices force dealers to sell more, driving implied volatility higher and amplifying price swings. This reflexive dynamic transformed what might have been a controlled pullback into a cascade of volatility spikes and wide intraday ranges, with the S&P 500 experiencing a 3.27% intraday range on June 10, surpassing even Friday’s 2.3%.
Volatility term structure and expected move bands have recently shifted, with the 1-month implied volatility rising above the 3-month, ending a protective inversion that had supported the market for eight weeks. This transition downgraded realized volatility signals from Bullish to Neutral and widened weekly expected move bands to nearly ±2%, signaling heightened uncertainty and the potential for larger price swings near term. Despite a recent VIX crush and normalization of the volatility curve, short-term volatility spikes remain elevated around key events like the June 18 VIX expiration and upcoming FOMC meeting, with put premium pricing reflecting persistent market concern for downside risk.
Underlying the index-level volatility is a pronounced divergence between elevated single-stock volatility and subdued index volume, driven by historically low implied correlations and elevated dispersion. This thematic concentration, especially in AI and technology sectors, fuels investor fear of missing out on upside rallies, while systematic option selling strategies—such as covered call ETFs—have become a dominant source of volume supply, shaping volatility dynamics and term structure. However, this dispersion-driven environment carries the latent risk of sudden correlation spikes, which could abruptly disrupt the fragile equilibrium and trigger amplified market-wide volatility.


Breadth Holds, Correlation Surges
Despite sharp declines, strong market breadth masks a dramatic shift to high-correlation trading, as sector leadership unwinds and volatility signals a fragile calm before potential storms.
Despite the S&P 500 experiencing notable price declines, the underlying market breadth remains structurally intact, with over 58% of members trading above their 200-day moving averages and the critical 40% breadth threshold far from breach. This resilience suggests the recent selloff reflects a synchronization of risk rather than a fundamental breakdown, as correlation surged sharply from previously depressed levels, transitioning the market from a low-correlation, dispersed regime to a high-correlation environment where sector leadership unwind, particularly in tech and semiconductors, amplified synchronized selling and volatility repricing.
Dealer positioning and systematic flows have played a pivotal role in heightening market fragility. Dealers hedged aggressively against crowded upside call exposure in sectors like AI, semiconductors, and memory, which fueled momentum that reversed sharply once selling pressure emerged. Concurrently, CTAs and vol-control strategies shifted to net selling, pushing the composite regime closer to Risk-Off territory despite realized volatility remaining subdued, underscoring how gamma flips and systematic selling intensify vulnerability to amplified price swings.
Volatility indicators reveal a market on edge beneath a superficially calm surface, with the VIX9D front-end volatility spiking above longer-dated measures, signaling traders’ heightened demand for near-term protection amid fragile conditions. This elevated short-term volatility demand, combined with narrow breadth participation—only three sectors (Tech, Energy, Discretionary) finishing green during recent bounces—and mixed signals from mega-cap tech near critical technical levels, reflects ongoing uncertainty as the market searches for equilibrium amid shifting leadership and correlation dynamics.
While the market held key technical supports such as the 50-day moving average during a 4.5% peak-to-trough pullback, breadth participation remained thin with just over half of S&P 500 members above their 50-day averages, indicating cautious optimism rather than broad-based strength. Encouragingly, recent rebounds exhibited broad participation beyond megacaps, and momentum indicators like RSI and MACD suggest a fragile but intact structure, highlighting a market poised delicately between recovery and renewed risk.

Resistance and Risk Collide
The S&P 500’s struggle at technical resistance is compounded by looming event risks and negative gamma, making any failed breakout a catalyst for intensified downside volatility.
The post-FOMC bounce in the S&P 500 has been characterized by a fragile and tentative upward trend, with the index repeatedly testing but failing to decisively break above key resistance levels near 7440 to 7458.50. Despite reclaiming support zones around 7400 and short-term value areas such as the 5-day VPOC at 7416, the market remains technically suppressed on the daily chart, underscoring the critical importance of a sustained daily close above 7458.50 to confirm any meaningful upside momentum. This delicate balance is further complicated by narrow market breadth, where strength is concentrated primarily in tech, energy, and discretionary sectors, while utilities, real estate, and materials lag, reflecting an uneven recovery that lacks broad-based conviction.
Dealer positioning and gamma dynamics are pivotal in shaping the market's fragile structure post-FOMC. The S&P 500 currently resides in a negative gamma environment below key dealer gamma flip levels—initially around 7550 and more recently elevated to(https://snpedge.vicitradingsolutions.com/p/s-and-p-500-daily-trade-plan-the-7c0)—where dealers hedge to the downside, amplifying volatility and contributing to a precarious market framework. As noted, the proximity of the gamma flip level directly beneath the index means that a failure to hold above 7520 could trigger a swift shift to downside hedging, accelerating price moves and intensifying intraday ranges, which have already expanded to over 140 points on some sessions. This environment demands cautious positioning, especially with monthly options expiration looming and event risks such as CPI data and Oracle earnings on the horizon.
Volatility indicators and event-driven risks continue to underscore the market’s fragile near-term outlook. The VIX9D remaining above the VIX and exhibiting backwardation signals that short-term event volatility is priced in, particularly ahead of critical economic releases like Wednesday’s CPI and major earnings reports such as Oracle’s. This elevated event risk, combined with technical resistance near the 10- and 20-day exponential moving averages and the looming head-and-shoulders pattern neckline at 7458.50, suggests that while the market is cautiously trending upward, it remains vulnerable to sharp reversals. Traders are advised to respect these key pivot levels, taking profits near resistance and preparing for potentially amplified price swings as dealer hedging and gamma dynamics interplay with fundamental catalysts.