Treasury bill surge whipsaws tech and volatility
The gist
A tidal wave of Treasury bill issuance in 2026 first juiced market liquidity, then yanked it away—triggering a tech stock tumble, a flight to safety, and surging volatility as funding pressures bite.
What to know
- By early 2026, Treasury bills nearly doubled as a share of government debt (from 11% to 23-24%), flooding markets with cash and fueling risky bets.
- Midyear, a $671 billion Treasury borrowing spree sucked $100 billion back out, pushing SOFR above 3.50% and hammering chipmakers and high-flying tech names as Nasdaq futures plunged up to 3%.
- From late July to early September, peak bill settlements drained liquidity and hit semiconductors hardest, with volatility spiking 58% of the time on settlement days—before a brief reprieve expected post-September 15.
Liquidity Surge Fuels Rotation
A tidal wave of Treasury bills unleashed fresh leverage, prompting investors to abandon tech giants for defensive stalwarts like Exxon and Eli Lilly.
By early 2026, the Treasury's ramp-up in short-term bill issuance nearly doubled the proportion of debt funded under a year from 11% to around 23-24%, a trend Bank of America expects to continue. This surge in Treasury bills injected substantial liquidity into the financial system, fueling repo and leverage activities that underpin market dynamics. These highly liquid assets effectively acted as fresh capital sloshing through the system, enabling investors to increase leverage and trade with greater confidence.
This initial liquidity expansion catalyzed a notable rotation in equity markets, with investors retreating from the high-beta tech giants like Meta, Microsoft, and Amazon—once the darlings of the AI-fueled rally—and reallocating capital into cyclicals and defensives. Institutional players favored mega-cap stalwarts such as Exxon and Eli Lilly, drawn by their liquidity and resilience, signaling a strategic pivot away from data center-dependent growth stocks toward sectors perceived as more stable amid evolving market conditions.

Borrowing Blitz Tightens Markets
The Treasury’s midyear $671 billion borrowing spree drained $100 billion from the system, spiking funding rates and triggering sector-specific volatility.
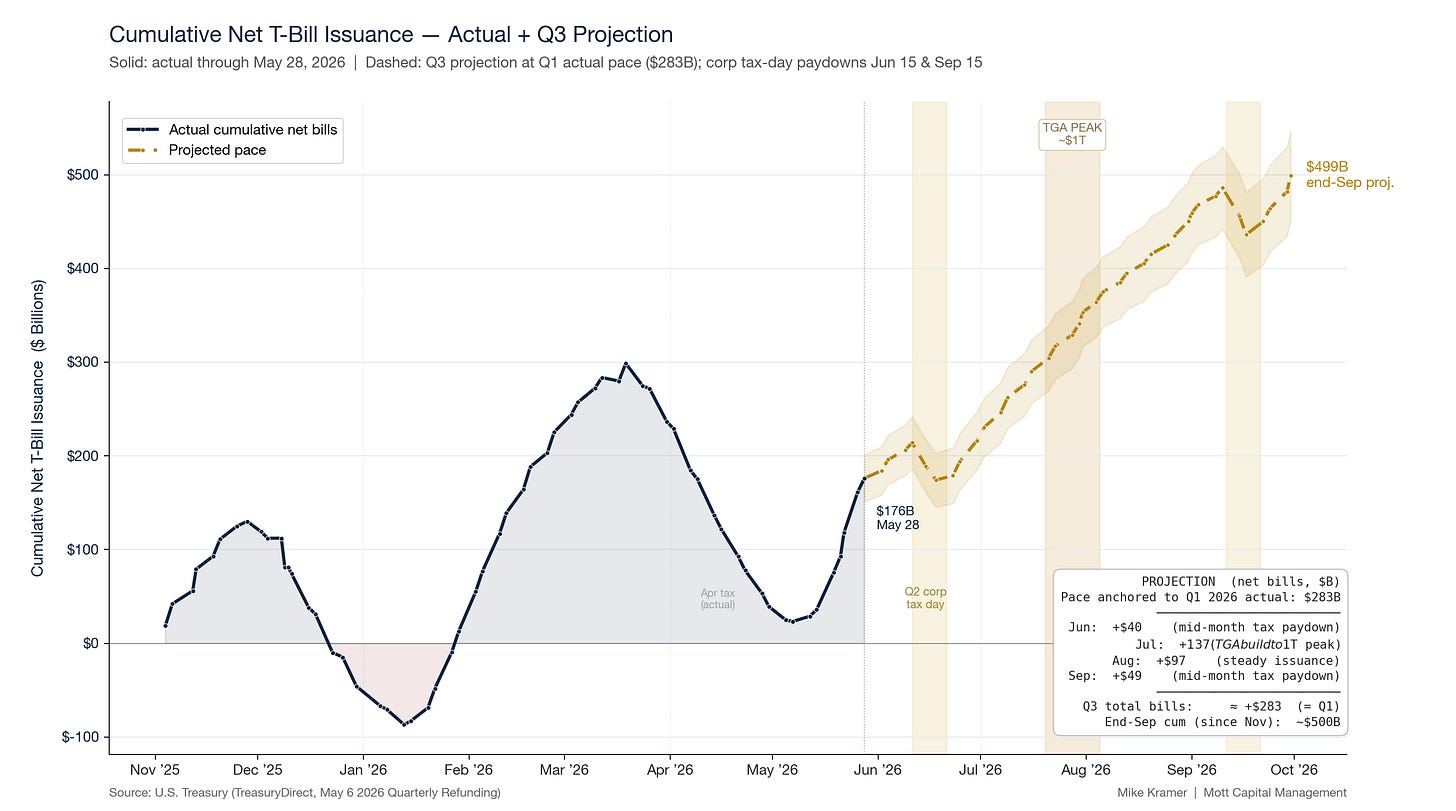
Beginning mid-2026, the Treasury significantly accelerated its borrowing, projecting $671 billion between May and September—up from $577 billion in Q1—primarily through increased T-bill issuance. This surge, absorbing roughly $100 billion in liquidity, reversed earlier market liquidity expansions and pushed key funding rates like SOFR above 3.50%, with the weighted-average repo rate climbing to 3.61%, signaling tightening funding conditions.
July marked a pivotal liquidity test as Treasury bill net issuance resumed with approximately $39 billion issued in the first week alone, coinciding with the Treasury General Account rebuilding from around $771 billion toward a $1 trillion peak by late July. This cash withdrawal from the banking system was projected to reduce reserve balances from $3.1 trillion down toward $2.75–$2.8 trillion, intensifying funding pressures and elevating short-term rates like SOFR.
Historically, these mid-year Treasury bill settlement dates have been flashpoints for market volatility, particularly impacting the semiconductor sector, which has risen only 40% of the time on such dates and averaged a 52 basis point decline in the SMH ETF. Concurrently, the VIX volatility index increased 58% of the time during settlements, underscoring how liquidity tightening phases translate into sector-specific weakness and broader market turbulence.

Tech Selloff and Volatility Loops
Relentless liquidity stress hammered chip stocks and triggered wild volatility, as dealer hedging and option flows amplified sharp market swings.
Markets reacted sharply to liquidity stress with repeated sell-offs concentrated in chip and technology stocks, notably Micron Technology, Nvidia, and Sandisk, which led declines in tech-heavy Nasdaq futures by as much as 3%. These episodes underscored investor sensitivity to memory-chip demand and AI-related trades, driving sector rotation away from the Mag-7 and hyperscalers toward more defensive or cyclical sectors like financials, healthcare, and consumer discretionary. Despite these pressures, broad indexes such as the Dow Jones and S&P 500 showed resilience with early rebounds and stabilization attempts, reflecting a market reassessing positions rather than capitulating to sustained sell-offs.
Volatility dynamics played a pivotal role in shaping market reactions, with event-driven spikes around key economic releases such as the CPI and Employment Situation reports. The VIX9D often remained elevated above the front-month VIX, signaling heightened near-term event risk and backwardation in volatility curves. This was compounded by option market makers’ negative delta exposure, which created reflexive selling loops that amplified price swings and intraday air pockets, as seen in the 50-point SPX drop on July 15 followed by a sharp gamma-driven recovery near strike clusters at 7525, 7550, and 7600.
Underlying the headline volatility and rotation was a nuanced interplay of market positioning and dealer hedging, which created sticky control zones—such as the 7350–7400 range in the S&P 500—where two-way trade and volatility persisted. Sector leadership shifted frequently within tech-related groups, with money rotating among semiconductors (SMH), the Mag-7 basket (MAGS), and software (IGV), maintaining a pinned index level while dispersing risk. This musical chairs dynamic was further influenced by flows around corporate earnings, economic data, and options rolls like QYLD, which subtly altered dealer hedging demands and contributed to ongoing dispersion trades beneath the surface.
Market participants approached key macroeconomic events with heightened sensitivity, treating reports such as the June CPI and upcoming NFP as critical inflection points that could either confirm recent repair phases or trigger renewed downside. Monday’s repair rallies, led by mega-cap growth and semiconductors, were often tested by subsequent sessions marked by quarter-end flows and mechanical positioning shifts, emphasizing the tentative nature of the recovery amid persistent liquidity stress. As one analyst noted, 'Monday was repair day... Tuesday is the quiz... Thursday’s NFP is still the final exam,' highlighting the evolving battle between bulls and bears in a fragile market environment.



Settlement Days Spark Turmoil
Heavy Treasury bill settlements in late summer consistently pressure equities and spike volatility, with only a brief liquidity reprieve on the horizon.
The late summer period from late July through early September marks the peak of Treasury liquidity drain, driven by heavy Treasury bill settlements totaling hundreds of billions of dollars. For instance, net new issuance reached about $39 billion in the first week of July alone, with total bill issuance estimated at $348 billion for the quarter, rapidly refilling the Treasury General Account (TGA) toward $1 trillion. This surge in settlements has historically exerted downward pressure on equity markets, particularly technology sectors such as the Semiconductor ETF (SMH) and the XLK technology sector, which have shown average declines of 40 and 41 basis points respectively on settlement days compared to gains on non-settlement days.
The liquidity drain's impact extends beyond tech, with the broader S&P 500 also underperforming on Treasury bill settlement dates—rising only 45% of the time with an average decline of 22 basis points versus a 60% rise and 14 basis point gain on non-settlement days. Moreover, these settlement days coincide with increased market volatility, as evidenced by the VIX rising 58% of the time, signaling a challenging environment for investors navigating this period. This pattern underscores the systemic nature of liquidity pressures during heavy Treasury settlements, which tend to amplify market rotations and volatility.
While the late July to early September window represents the peak liquidity drain, a temporary reprieve is anticipated starting in early September as Treasury bill settlements diminish and paydowns resume. The TGA is expected to peak near $1 trillion in late July before declining to around $950 billion by the end of September, with paydowns likely returning after the September 15 tax date. This shift could ease liquidity pressures temporarily, providing a breather for markets before potential year-end challenges reemerge, highlighting the cyclical ebb and flow of Treasury-driven liquidity dynamics.